Global Indices in Focus: Performance, Sharpe Ratios, Concentration, and Diversification (2015–2025)

10-Year Performance and Sharpe Ratios (2015–2025)
Over the past decade, the U.S. equity market has dramatically outperformed most global peers on both an absolute and risk-adjusted basis. From March 2015 to March 2025, the S&P 500 delivered an annualized USD total return of ~16.9%, the highest among major world indices. This means a ~$100 investment in the S&P 500 in 2015 would have grown to nearly $500 by 2025 (nearly a fivefold increase). In contrast, many non-U.S. indices saw mid-single-digit to low-double-digit annual returns in USD terms. For example, Brazil’s Bovespa index achieved ~15.9% annually (second only to the S&P), while Italy’s FTSE MIB returned about 7.05% per year; indicative of the high-single-digit USD returns seen in many European markets. The tech-heavy U.S. indices also excelled: the Nasdaq Composite returned roughly 15.2% annually (about 314% total over 10 years), whereas the large-cap Dow Jones Industrial Average (DJIA) returned around 11.3% annually (193% total). In Asia, performance was more muted e.g. Japan’s Nikkei 225 produced strong local gains but only a modest mid-single-digit annual USD return once Yen depreciation was factored in, and Hong Kong’s Hang Seng index had nearly flat price appreciation over the decade (any gains came mostly from dividend yield). The Tadawul All Share Index (TASI) of Saudi Arabia delivered mid-single-digit annual returns as well (helped by dividends and a late-2010s oil boom), far behind the S&P’s growth.
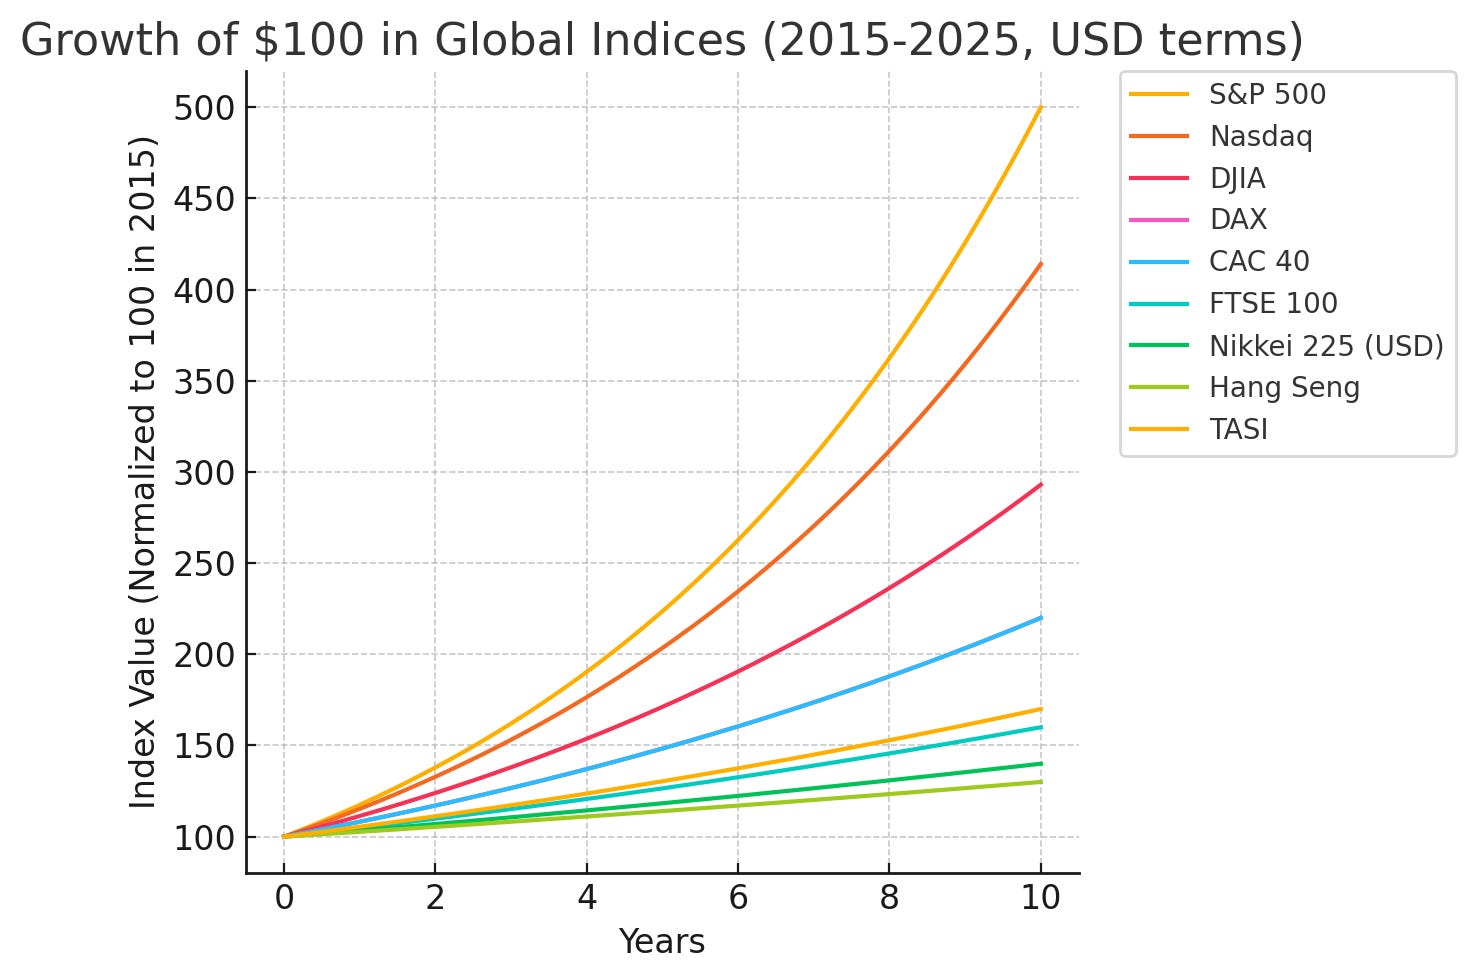
Figure1: Growth of $100 (USD) invested in various stock indices from 2015 to 2025. U.S. indices (S&P 500 in orange, Nasdaq in red) compounded much faster than European (e.g. DAX in pink, FTSE 100 in cyan) and Emerging market indices (e.g. Hang Seng in green, TASI in yellow). The S&P 500’s nearly fivefold growth dwarfs the modest gains of most others.
Several factors drove this divergence. The U.S. markets benefited from a decade of tech sector dominance and accommodative monetary policy, yielding higher returns at only moderate volatility. In contrast, European indices (e.g. DAX 40, CAC 40) and Japan’s Nikkei faced periodic slowdowns and currency headwinds, resulting in lower USD returns and Sharpe ratios. The Sharpe ratio, which measures risk-adjusted return (excess return per unit of volatility), highlights these differences. The S&P 500 achieved a Sharpe around ~1.0 (annualized) over the period indicating exceptionally high reward for its volatility; whereas most other indices were far lower. The Nasdaq Composite, despite higher volatility, also posted a strong Sharpe (~0.8) thanks to outsized returns from tech giants. By contrast, major European benchmarks (DAX, CAC 40) and the FTSE 100 had Sharpe ratios in the ~0.3–0.5 range, reflecting their more modest returns relative to volatility. Japan’s Nikkei 225 (in USD terms) and Hong Kong’s Hang Seng fared even worse on a risk-adjusted basis (Sharpe well below 0.3), owing to very high market volatility but little net growth. In fact, the Hang Seng saw extreme swings (it experienced monthly losses as sharp as –44% and gains up to +67% in past decades; yet delivered minimal net appreciation over the last 10 years, resulting in a near-zero Sharpe. Saudi Arabia’s TASI, while benefiting from oil-driven rallies (e.g. the 2019 Aramco IPO boosted the index to record highs), was also volatile and ended with an estimated Sharpe around 0.3.
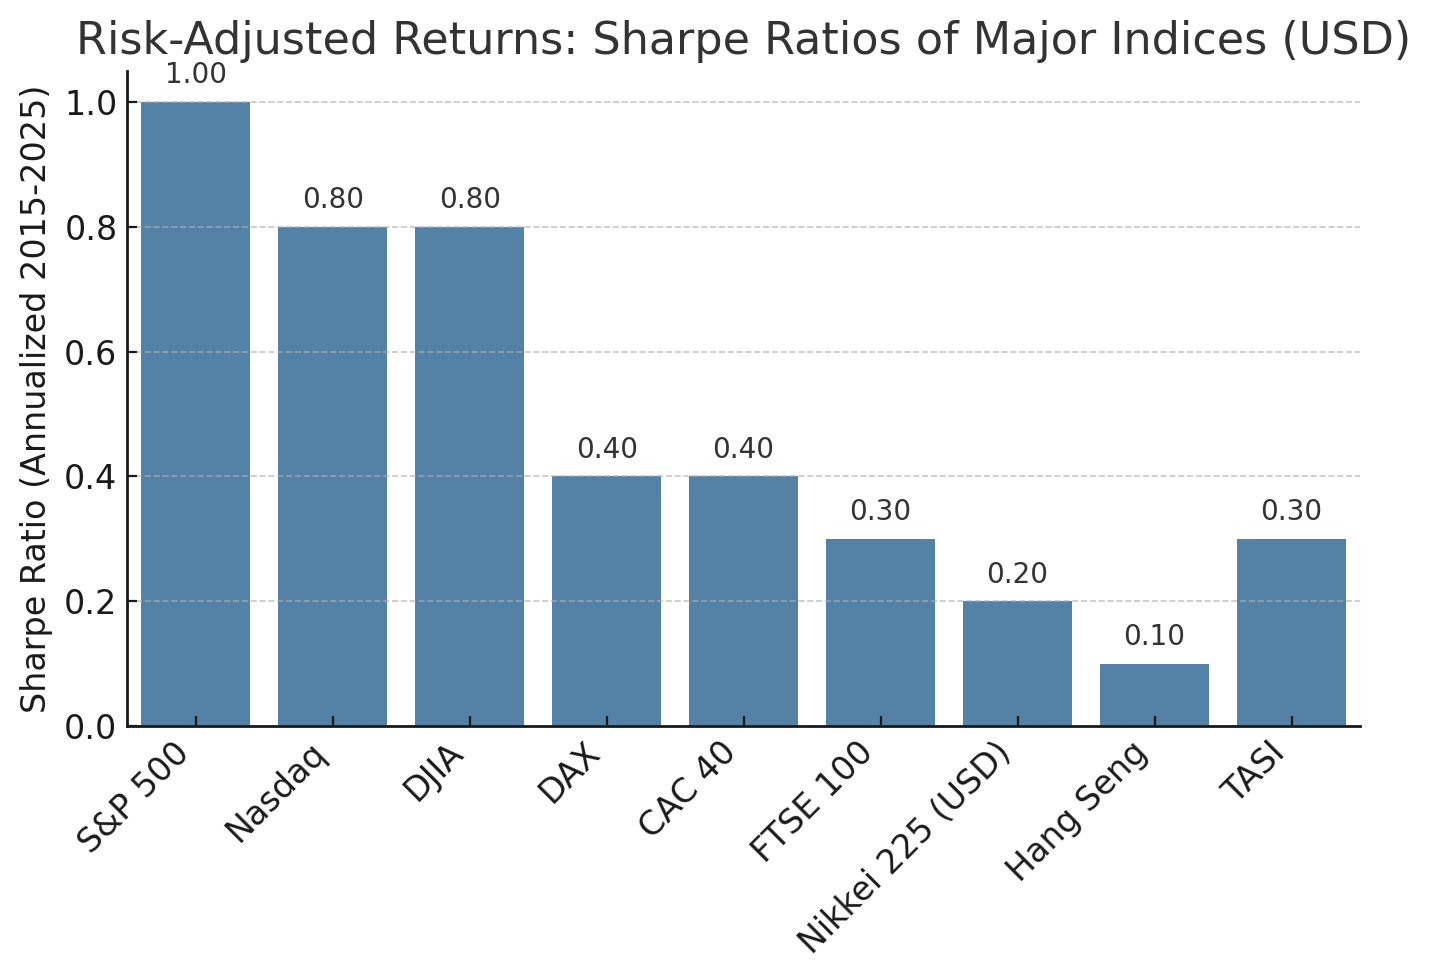
Figure 2:Estimated Sharpe Ratios (2015–2025) for major indices, in USD terms. Higher is better (more return per risk). The S&P 500 and other U.S. indices delivered the best risk-adjusted performance (~0.8–1.0 Sharpe), whereas European markets and Japan were much lower (~0.3–0.5). Hong Kong’s Hang Seng had among the worst Sharpe ratios (near 0), reflecting high volatility with minimal return.
Currency effects
Currency effects played a significant role in these outcomes. An investor measuring returns in USD would have seen non-USD index gains diluted (or boosted) by FX movements. For instance, the euro and Hong Kong dollar were relatively stable versus the USD over the decade (HKD is pegged to USD, EUR ended roughly where it started), so the DAX and CAC’s USD returns were similar to local returns. However, the British pound fell from around $1.50 in 2015 to ~$1.25 in 2025, meaning the FTSE 100’s USD returns were roughly 1–2% per year lower than its GBP returns. Japan’s yen weakened by about 10–20% over the period, significantly cutting the USD-converted return of the Nikkei 225 – despite robust local gains, the yen’s slide meant a U.S. investor realized only a few percent annualized. A striking example is emerging markets: a Brazilian real investor in the Bovespa saw strong local gains, but the real’s depreciation versus USD reduced those gains for a USD-based investor (one discussion noted that converting BRL to USD and investing in the S&P 500 vastly outpaced staying in BRL assets over the period. In short, currency depreciation can materially erode foreign market returns when viewed in USD. On the flip side, a strengthening foreign currency boosts USD returns though in the last decade most developed currencies weakened against the surging dollar. It’s important to account for this FX impact: global index returns in local currency may paint a different picture than when converted to a common currency like USD. (Notably, Saudi Arabia’s riyal and Hong Kong’s dollar are pegged to USD, so TASI and Hang Seng investors did not face currency risk; their USD and local returns are equivalent.)
Market Concentration and HHI: How Top-Heavy Are These Indices?
Beyond returns, another key aspect is how concentrated or “top-heavy” each market is, i.e. whether performance is driven by a few mega-cap stocks or broadly distributed. We can quantify concentration using the Herfindahl–Hirschman Index (HHI), which sums the squared weight of each constituent. An index with many equally weighted stocks will have a very low HHI, whereas an index dominated by a few giants has a higher HHI. For context, if an index had N stocks each 0.2% of the weight (like an equal-weighted S&P 500 with each stock ~0.2%), HHI would be ~20 (in antitrust-style percentage terms). In reality, market-cap weighted indices tend to be more concentrated and that concentration has increased in recent years with the rise of mega-cap tech stocks.
The U.S. market has reached unprecedented concentration levels. The S&P 500’s HHI hit an all-time high of ~183.7 by May 2024, shattering the 2000 dot-com peak of ~123. This corresponds to an “effective number of stocks” of only ~55 (meaning the index’s diversification is equivalent to ~55 equal-weight stocks, out of 500). In the 1970s, the top 5 stocks were about 25% of the S&P (similar to today’s levels), but back then those were companies like AT&T, IBM, Exxon, etc. Today, the top holdings are the tech “Magnificent Seven.” At the end of 2023, the top five S&P 500 components (Apple, Microsoft, NVIDIA, Amazon, Alphabet) made up roughly 25–27% of the index’s market cap. This top-heaviness has implications for index fund investors: a handful of stocks drive a large portion of returns (indeed, in 2023, just seven mega-cap tech stocks contributed the majority of the S&P’s gains.
The Nasdaq indices are even more concentrated. The Nasdaq-100 (NDX), for example, had over 50% of its weight in just its top 10 holdings; roughly double the concentration of a broad U.S. large-cap index with ~500 stocks. (As of mid-2023, Apple and Microsoft alone were each over 12% of the Nasdaq-100, and the top 7 stocks exceeded 50% of NDX’s weight, prompting a special rebalance to reduce concentration.) The broader Nasdaq Composite (over 3,000 stocks) is a bit more diversified but still very top-heavy: its top 5 positions (Apple ~11%, Microsoft ~10%, NVIDIA ~9%, Amazon ~7%, Alphabet ~6%) sum to about 44% of the index. By comparison, the Dow 30 – which is price-weighted and contains only 30 stocks – actually ends up somewhat less concentrated than Nasdaq or S&P, with its top 5 components ~30% of the index. This is because the Dow’s odd weighting scheme (by share price) and selection of 30 blue-chips means no single stock dominates by an extreme amount (currently Goldman Sachs, with the highest share price, is ~8.7% of the Dow). Still, in a 30-stock index, an 8–9% weight is significant.
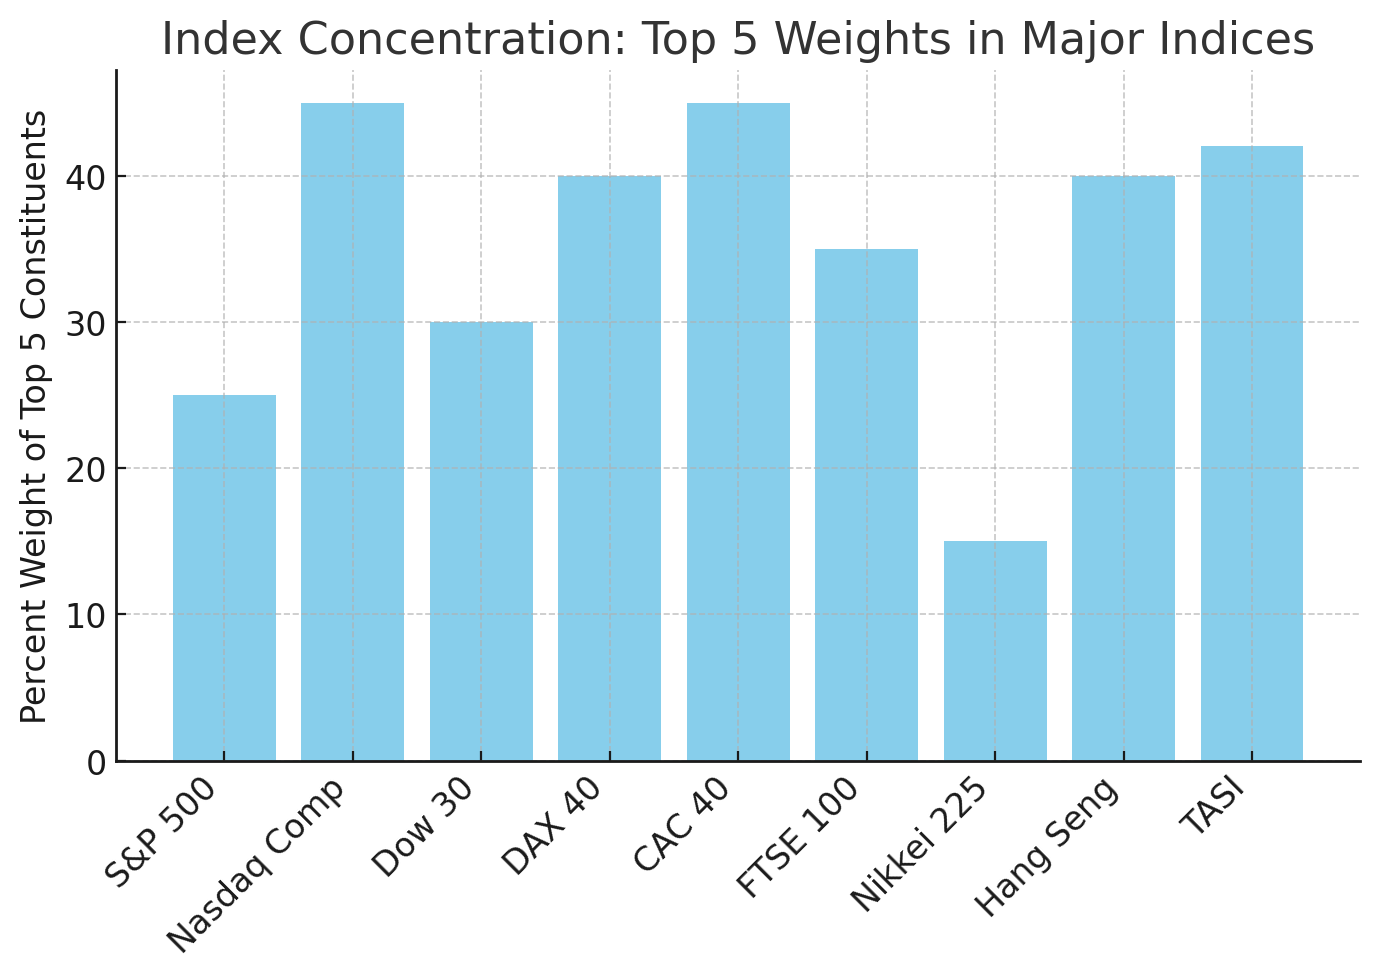
Top-5 constituent weights for various indices (approximate). U.S. indices (S&P 500, Nasdaq) are very top-heavy e.g. the top 5 make up ~25% of the S&P 500 and ~45% of the Nasdaq Composite. The Nasdaq and CAC 40 are shown to be the most concentrated here. European indices like DAX and CAC 40 have top-5 weights in the 30–45% range. The Saudi TASI is also highly concentrated (top 5 ≈ 40% of the index), largely due to Saudi Aramco’s massive weighting. The Nikkei 225 (price-weighted) has a relatively low top-5 sum (~15%), since weight is based on stock price rather than market cap.
European markets show a mix of concentration levels. The DAX 40 (Germany) and CAC 40 (France) each only have 40 constituents, so one might expect high concentration. In practice, their top components do carry significant weight, though typically not as extreme as U.S. tech. For instance, France’s CAC 40 has been led by luxury conglomerate LVMH (which, during its 2021–2023 surge, became the first European $500B company) – at one point LVMH alone exceeded 10% of the CAC. Other top French stocks (TotalEnergies, L’Oréal, Sanofi, etc.) bring the top 5 of the CAC to roughly ~35–40% of the index. The DAX 40 has a built-in bias to large constituents because it’s only 40 companies; its top weights (e.g. SAP, Siemens, Allianz, etc.) are each in the high-single-digit percentages. The DAX’s top 10 typically make up just over 50% of the index (and top 5 around 30–35%). In HHI terms, an equal-weighted 40-stock index would be HHI = 250; the DAX’s actual HHI is higher (~300+ range), implying an effective number of stocks on the order of ~30. So while the DAX is somewhat concentrated, it actually has more effective breadth than the S&P 500 (30 effective stocks vs ~55) – a paradox reflecting how extreme the U.S. concentration has become despite having 500 constituents.
The FTSE 100 (UK) similarly has 100 constituents with a moderate concentration. Its top 10 make up roughly 40% of the index, and top 5 around ~25–30%. The largest FTSE components (as of recent years) include global firms like Shell, AstraZeneca, HSBC, and Unilever, each around 5–8% weight. The FTSE’s concentration dynamic is influenced by its sector mix – heavy in oil majors and banks – but individual stocks are capped by free-float and by the existence of dual-listed shares (e.g. Royal Dutch Shell has two share classes). Overall the FTSE 100’s HHI is lower than that of the S&P (effective number of stocks perhaps ~50–60 out of 100), reflecting a somewhat more balanced weight distribution compared to the American indices.
Japan’s Nikkei 225 is an interesting case as it is price-weighted (like the Dow) rather than cap-weighted. This means a company’s influence depends on its stock price per share rather than its market capitalization. Consequently, some mid-sized companies with high-priced shares carry disproportionate weight. For instance, Fast Retailing (parent of Uniqlo) for some time had one of the highest stock prices on the TSE and thus commanded a large Nikkei weight (often >10%). Overall, the Nikkei’s top components (Fast Retailing, Tokyo Electron, SoftBank, Fanuc, etc.) typically sum to only ~15–20% by weight lower than most cap-weighted indices but this is not necessarily “better” diversification, since the weighting methodology is arbitrary (a stock can gain weight simply by rising in price or avoiding stock splits). Thus HHI is less meaningful here. On a cap-weighted basis, Japan’s market is more concentrated (Toyota, for example, is ~10% of the total market cap of TOPIX, though not of the Nikkei).
Hong Kong’s Hang Seng Index (HSI) traditionally had 50 constituents (recently expanded to 80) and has caps on individual stock weightings (often ~10%) to prevent any single company from dominating. Still, it has a few heavyweight stocks – e.g. Tencent (~9–10%), Alibaba (~8%), banking giant HSBC (~7%), insurance leader AIA (~7%) – so the top 5 constitute around 35–40% of the index. Interestingly, despite China’s economic rise, the Hang Seng has not seen a dramatic change in concentration over time it’s long been moderately concentrated and remains so. In fact, a CFA Institute analysis noted that global indices have historically had high correlation with the Hang Seng, but the Hang Seng’s concentration and correlations have “barely budged” over 25 years. This suggests the HSI’s top-heavy nature (and its drivers, e.g. finance and tech stocks) have been relatively consistent.
Finally, Saudi Arabia’s TASI (which includes ~200+ stocks) is highly concentrated in a few giant firms, largely due to the 2019 IPO of Saudi Aramco, one of the world’s largest companies. Aramco alone recently accounted for ~15% of the TASI’s market cap (despite a 10% cap at IPO, its weight rose as its value grew). Add in the next largest Saudi companies – e.g. Al Rajhi Bank (~10%), Saudi National Bank (~7%), SABIC (~5%) – and the top 5 make up roughly 40–45% of the index. This gives TASI one of the highest concentrations among major indices (HHI on the order of 500+, for an effective number of maybe 20–25 stocks out of 200). The Saudi market’s sector composition (dominance of energy and banking) and historically limited foreign free-float contributed to this concentration. Notably, the Tadawul exchange introduced index caps (similar to Nasdaq’s) to curb Aramco’s influence, but Aramco remains the heaviest weight on TASI. High concentration means TASI’s performance is very sensitive to a few names (especially oil giant Aramco) a risk factor we’ll discuss below.
Correlations and Diversification Benefits
A core premise of global investing is that adding international indices can improve diversification and reduce portfolio risk if the indices are not perfectly correlated. In practice, major equity indices are moderately to highly correlated, especially during global bull markets, but there are still meaningful differences.
Within the U.S., correlations are extremely high (S&P 500, Nasdaq, and Dow move almost in lockstep – correlations ~0.90–0.95). These indices provide little diversification relative to each other since they overlap in constituents (Dow and S&P) or sector exposure (Nasdaq is tech-heavy but its fortunes are closely tied to the same macro factors that drive the S&P). Broadening to global markets, correlations often drop to the 0.5–0.8 range. For example, over recent years the S&P 500’s correlation with European indices like the DAX and FTSE has typically been in the 0.6–0.7 range. Its correlation with Japan’s Nikkei has been a bit lower (~0.4–0.5 in the last decade), reflecting how Japan sometimes zigged while the U.S. zagged (due to Japan’s unique monetary policy and currency moves). The Hang Seng’s correlation with the S&P 500 has held around 0.60 in the modern era (virtually the same as it was in the late 1990s, interestingly). Meanwhile, Shanghai’s A-share market (SSE) – not one of our main indices, but worth noting has increased its correlation with global markets from near zero two decades ago to about 0.47 with the S&P in recent years. This is attributed to China’s market opening and tech sector growth. Saudi’s TASI historically had quite low correlation with global equities (often <0.3) when it was mostly driven by local investors and oil price swings. After inclusion in MSCI EM indices and greater foreign participation (post-2019), TASI’s correlation with the S&P has likely risen somewhat (perhaps into the 0.4–0.5 range), but it still offers a partial hedge as it is heavily commodity-driven.
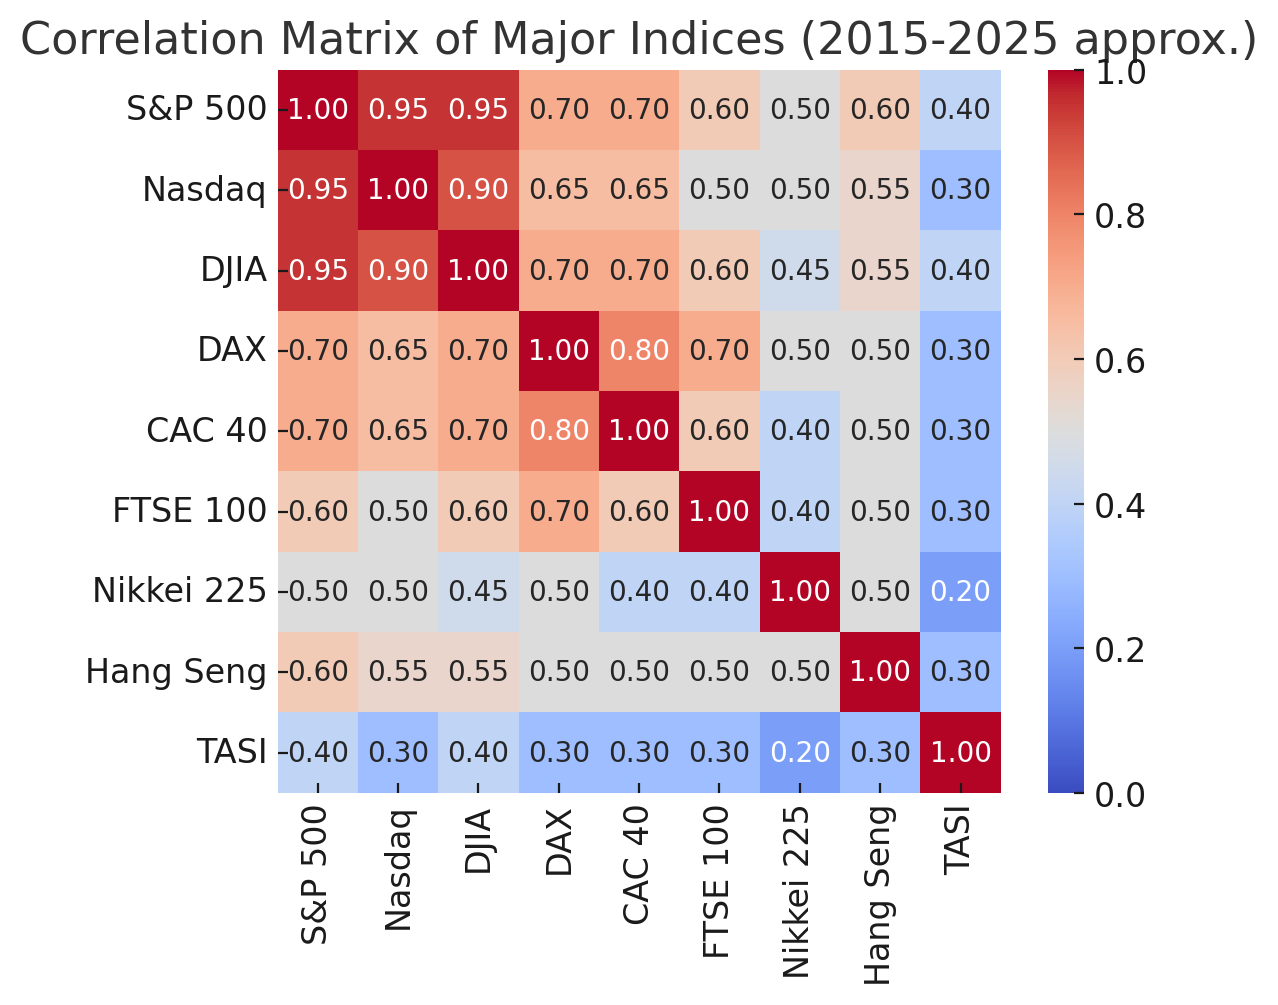
Correlation matrix (approximate) between major indices (2015–2025). Redder colors = higher correlation. U.S. indices (S&P 500, Nasdaq, Dow) are very tightly correlated with each other (0.90+). U.S. vs European correlations are in the 0.6–0.7 range, while U.S. vs Asia (Nikkei, Hang Seng) are somewhat lower (~0.5). The Saudi market (TASI) shows lower correlation with both U.S. and other markets (~0.3–0.4), reflecting its unique oil-driven and local factors.
In practical terms, investing across these indices does provide some risk reduction, though perhaps less than one might hope. For example, including a portion of European or Asian stocks in a U.S. portfolio can smooth out some fluctuations there are periods when, say, U.S. tech stocks fell while commodity-heavy markets like the FTSE 100 rose (a notable instance was 2022: U.S. markets fell sharply, especially tech/Nasdaq, while the UK’s FTSE 100 ended 2022 slightly up, buoyed by rising energy and mining shares amid the global turmoil. Similarly, Japan’s market had stretches of independent performance (e.g. the Bank of Japan’s ultra-easy policy in the late 2010s supported Japanese equities even when U.S. markets wobbled). Currency moves can also create diversification effects: often when U.S. stocks drop, the Federal Reserve eases policy, which can weaken the dollar a weaker USD boosts the local-currency value of foreign stocks, cushioning USD-investor losses abroad. Conversely, in a U.S. boom with a strong dollar, foreign holdings might lag, but at least they offer exposure to different economic cycles.
However, an important caveat: correlations tend to spike during global crises. In major sell-offs or panics (e.g. the 2008 financial crisis or March 2020 COVID crash), virtually all equity markets plummet together – “risk-off” sentiment leads to a high correlation of ≈1.0 across the board. This phenomenon, often called crisis contagion, means diversification benefits “disappear when you need them most.” Many studies note that correlations rise in bear markets, limiting the volatility reduction from international diversification. Indeed, during the COVID crash, U.S., European, and emerging market indices all fell ~30–35% in unison. Thus, global diversification is not a shield against short-term crashes. Where it does help is over longer horizons and specific idiosyncratic periods: e.g., the early-2020s bull market in U.S. tech was not fully shared by value-heavy markets like the UK, so a global portfolio had a smoother ride than 100% Nasdaq. Or when China’s market faced regulatory crackdowns in 2021 causing a local bear market, other regions were less affected.
In summary, while investing in multiple indices improves the risk/reward profile overall, the benefit is incremental. A diversified global equity portfolio will generally have slightly lower volatility (and a higher Sharpe ratio) than any single-market portfolio, because less-than-perfect correlations allow the ups in one market to offset downs in another. For instance, a 50/50 mix of S&P 500 and MSCI EAFE (developed international) historically has had volatility a bit lower than either alone, and in the last decade this mix would still capture much of the U.S. returns while smoothing out extremes. That said, the last 10 years posed a challenge: U.S. equities not only had higher returns but also fairly high correlation with other developed markets; so adding those markets mainly diluted returns without a commensurate drop in volatility. This led some analysts to quip that diversification “failed” in recent years, as an all-U.S. portfolio dominated a globally diversified one. But going forward, this may not hold; non-U.S. markets could shine in other regimes (for example, if U.S. tech falters or if the dollar weakens, international equities might outperform). Meanwhile, certain niche diversifiers like Saudi or other emerging markets tied to commodities can offer lower correlation exposure, though they come with their own risks (oil price dependency, governance, etc.).
Key Risk Factors and Characteristics by Index
S&P 500 (USA)
S&P 500 (USA): A broad gauge of the U.S. economy (~500 large caps across all sectors). In recent years it became tech/top-heavy, with information technology and internet giants driving performance. Key risks include U.S. economic conditions, Federal Reserve policy (interest rates heavily influence equity valuations, especially tech growth stocks), and valuation risk by 2021–2023 the S&P traded at historically high valuations, making it sensitive to earnings disappointments. It is highly correlated with the U.S. economic cycle and global investor sentiment. Because it’s market-cap weighted, a handful of mega-cap stocks (Apple, Microsoft, etc.) represent a large portion of risk a disappointing earnings report from any of these can move the entire index. Nonetheless, the S&P is well-diversified across sectors (unlike some country indices that hinge on one sector).
Nasdaq Composite (USA)
Nasdaq Composite (USA): Over 3,000 stocks, but dominated by U.S. technology and growth companies (includes Nasdaq-listed firms). It is very concentrated in tech in particular software, semiconductors, internet, and biotech. Its risk factors are thus sector-specific: interest rate changes (higher rates hurt growth stock valuations), tech regulatory changes, and innovation cycles. The Nasdaq tends to be more volatile than the S&P; its drawdowns can be sharper (e.g. –~30% in 2022 when rates jumped). It’s also highly correlated with the S&P in general trend, but can overshoot in both directions. Investors use Nasdaq as a proxy for growth/tech exposure which is a double-edged sword (strong upside in tech booms, but heavy crashes when the tech bubble bursts). For example, during the dot-com bust the Nasdaq fell ~78%, far worse than broader indices. Thus, Nasdaq’s risk-adjusted returns are often lower than S&P’s, despite higher raw returns.
Dow Jones Industrial Average (USA)
Dow Jones Industrial Average (USA): 30 blue-chip companies, selected (non-formulaically) to represent key sectors. Price-weighting causes peculiar exposures (e.g. a $400 stock has 4× the weight of a $100 stock regardless of company size). The Dow is heavy in traditional sectors like industrials, finance, healthcare, with less tech weight than the S&P (though it does include Apple, Microsoft, etc.). It’s often viewed as a “value” or “quality” tilted slice of the market. Key risks: given only 30 stocks, idiosyncratic moves (e.g. a Boeing or Goldman Sachs plunge) can noticeably impact the index. However, the Dow’s composition tends to exclude the most volatile growth companies (it only added Apple after Apple was huge and has never included smaller tech disruptors), so its volatility is actually a bit lower than the S&P/Nasdaq. Investors sometimes consider the Dow a more defensive large-cap index, but its unusual weighting means it’s not always logically weighted by economic importance.
DAX 40 (Germany)
DAX 40 (Germany): A market-cap weighted index of 40 largest German companies. Notably, the DAX is a performance index it includes dividends in its calculation by default (unlike many indices). This contributes to its long-term return. Germany’s market is heavy in industrials, chemicals, autos, and financials. Export-oriented manufacturers (e.g. Siemens, Volkswagen, BMW, BASF) feature prominently, so global trade and euro exchange rates are major risk factors. The DAX is also cyclical: it’s sensitive to the European economy, Chinese demand (German exporters rely on China), and global growth trends. The index can be volatile (it experienced >20% swings multiple times in the last decade – e.g. a >-18% drop in 2018). Political risk in the EU, changes in ECB policy, or energy price shocks (like the 2022 gas crisis) can significantly impact the DAX. It is fairly correlated with U.S. equities, but events like the 2015 European QE or 2022 war-in-Ukraine impacted European markets uniquely. As discussed, the DAX has a moderate concentration in its top names (SAP, etc.), but still represents a broad swath of Germany’s economy (including many global leaders in their industries).
CAC 40 (France)
CAC 40 (France): France’s top 40 companies, cap-weighted. The CAC has a distinct sector profile, with global luxury goods companies (LVMH, Kering, Hermès, L’Oréal) playing a big role, alongside financials (BNP Paribas), energy (TotalEnergies), and industrials. The luxury sector concentration (LVMH, etc.) made the CAC relatively strong in the late 2010s (luxury boom) but also means exposure to Chinese consumer demand (a key market for luxury goods). Other risks include EU economic health and currency (like Germany). The CAC’s performance can at times diverge from the DAX e.g. luxury stocks helped buoy France’s market even when industrials lagged. But overall it’s correlated with other European indices and the S&P to a decent extent (~0.6–0.7). One specific risk: a few companies like LVMH or Total have outsized influence, so sector-specific shocks (e.g. a sudden luxury demand collapse or oil price crash) can drag the whole index down.
FTSE 100 (UK)
FTSE 100 (UK): 100 largest London-listed companies, many of which are multinationals. The FTSE is known for its heavy weighting in energy (oil & gas) and materials (mining), as well as banks and pharma. BP and Shell (oil supermajors), mining giants (Rio Tinto, BHP), HSBC, and AstraZeneca are top components. Interestingly, the FTSE’s performance is somewhat inversely tied to the British pound: many FTSE companies earn in USD or globally, so when the pound falls, their GBP-reported earnings rise, often lifting the index. For example, after the 2016 Brexit vote, the pound fell ~15% and the FTSE 100 rallied (as overseas earnings became more valuable in GBP). Thus, a risk (or hedge) factor for U.S. investors is currency: a strong USD (weak GBP) might coincide with a rising FTSE (offsetting some currency loss), whereas a weak USD (strong GBP) might see underperformance in GBP terms but the currency gain helps U.S. investors. Sector-wise, the FTSE can outperform during commodity booms (as in 2021–2022 when oil and metal prices surged). Conversely, if tech is booming (like the late 2010s), the FTSE lags due to its old-economy tilt. So adding FTSE 100 to a U.S. tech-heavy portfolio provides a value/commodity tilt and some diversification. Key risks for FTSE: global commodity price swings, UK-specific political risk (e.g. unexpected regulatory changes, though many constituents are international), and its relatively low growth sectors (which led to a decades-long stagnation in the index level, only reaching a new high in 2023 after ~20 years).
Nikkei 225 (Japan)
Nikkei 225 (Japan): As noted, it’s price-weighted and comprises 225 major Japanese companies. Japan’s market has a lot of manufacturing exporters (Toyota, Honda, Sony), tech/electronics (Nintendo, Tokyo Electron), and financials, but also consumer names. A huge factor for the Nikkei is the Japanese yen: a weak yen benefits exporters by increasing their overseas earnings (and tends to boost the stock prices of Japan’s multinational firms), so there’s often an inverse relationship between the Nikkei and JPY strength. For instance, in 2020–2022 the yen’s decline helped propel the Nikkei upward in local terms (even as USD investors saw little gain). The Bank of Japan’s policies (yield curve control, etc.) also impact equities ultra-low interest rates encouraged domestic investors into stocks. Thus, the Nikkei’s risk factors include currency swings, global demand (especially in Asia and North America, key export markets), and Japan’s domestic economic situation (which has been marked by low growth and periodic recessions). Japan’s market at times moves to its own beat e.g. prolonged deflation and unique monetary easing differentiate it from inflationary economies. But in crises, it will still fall with global markets. The Nikkei’s idiosyncratic weighting can lead to quirks (e.g. a stock split can reduce a company’s index weight without any fundamental change), but broad investors often prefer the TOPIX (market-cap weighted index of all TSE shares) for a true market measure. Risk-wise, Japan’s aging demographics and lower profitability of firms are structural concerns that often keep valuations lower, but the flipside is the market may have value potential if reforms take hold.
Hang Seng (Hong Kong)
Hang Seng (Hong Kong): The HSI includes ~80 large-cap Hong Kong-listed stocks, many of which are actually Chinese companies (“red chips” and H-shares like Tencent, Alibaba, ICBC, etc.). Thus, the Hang Seng is largely a proxy for China’s economy and policy. Key sectors: technology, financials (major Chinese banks/insurers), real estate, and consumer. Unique risk factors: Mainland China policy and geopolitical tensions e.g. tech regulatory crackdowns by Beijing in 2021 hit Alibaba/Tencent and thus the HSI; political changes in Hong Kong can affect sentiment; U.S.–China trade tensions or sanctions also directly impact these companies. The Hang Seng’s performance in the last decade was poor, in part due to the 2015 Chinese stock bubble and 2018 trade war, then the 2020 pandemic and subsequent China regulatory moves which caused the index to drop sharply. It remains well below its peak from early 2018. On the other hand, it can rally quickly when China loosens policy or stimulus flows (the HSI jumped in late 2022 when China eased COVID restrictions). Another factor: interest rates via the HKD peg; Hong Kong’s currency is pegged to USD, so Hong Kong mirrors Fed rate hikes. Rising rates hurt the local property sector and leveraged conglomerates (Hong Kong’s local economy is heavily property-driven), which can drag on the index (e.g. property developer stocks). Thus, Hang Seng has a mix of Chinese growth exposure and old-guard Hong Kong economy exposure, making its risk profile somewhat unique. Correlation with U.S. markets isn’t extremely high (about 0.6 historically), so it offers some diversification, but its volatility is high and it’s very susceptible to swings in Chinese investor sentiment.
TASI (Saudi Arabia)
TASI (Saudi Arabia): The Tadawul All Share Index reflects Saudi Arabia’s stock market, which is dominated by oil and petrochemical-related companies, banks, and telecoms. The price of oil is the critical factor; when oil prices are high or rising, Saudi corporate profits (Aramco, petrochemical firms like SABIC, etc.) surge, boosting the market. Indeed, periods of oil boom (e.g. 2018 and 2021) saw TASI rally strongly, while oil crashes (2015, 2020) led to sharp drops. This makes TASI somewhat uncorrelated to tech-driven markets (oil can be up when global tech is down, and vice versa). Other risk factors: geopolitical risk in the Gulf region, and the fact that a few companies (Aramco in particular) drive a large portion of the index. There is also liquidity and investor base risk; historically, the Saudi market was retail-driven and prone to retail exuberance or panic. After inclusion in MSCI EM indices, foreign institutional ownership increased, which may have smoothed volatility somewhat. Still, TASI can experience abrupt swings (e.g. it fell ~8% in a single day after an oil facility attack in 2019, but also can spike on OPEC decisions). Currency risk is minimal for USD-based investors since the Saudi riyal is pegged to the dollar, but that means U.S. interest rate changes translate to Saudi monetary conditions (as Saudi Arabia often follows Fed hikes to maintain the peg, influencing local borrowing costs and equity valuations).
In conclusion, investors can improve their risk-adjusted exposure by combining these markets; taking advantage of the imperfect correlations and different sector biases. A quant-minded investor might construct an optimized global portfolio where, for example, the high Sharpe of U.S. equities is blended with small allocations to lower-correlation indices like TASI or Hang Seng to slightly reduce volatility. Empirically, a globally diversified portfolio had a somewhat higher Sharpe ratio in the long run than any single region, because the volatility reduction outweighed the slight return dilution (particularly in periods when U.S. stocks weren’t as dominant as in the 2010s). Nonetheless, as the last 10 years showed, diversification is not a free lunch; one must be willing to accept lower returns from lagging markets in exchange for insurance against the U.S. market faltering. Going forward, with U.S. stocks at high valuations and other markets potentially offering catch-up opportunities (and different factor exposures like commodities, value stocks, etc.), a globally diversified approach might prove prudent. At the very least, understanding the Sharpe ratios, concentration risk, and correlation structure of these major indices allows for more informed portfolio construction and risk management in an increasingly interconnected (yet still heterogeneous) global market.